Every modern industrial plant relies on a Distributed Control System (DCS) to ensure efficient operation, process optimization, and plant safety. A DCS consists of two primary components: hardware and DCS software. While the hardware manages field devices, controllers, and communication networks, the software layer performs data acquisition, control functions, monitoring, alarm handling, and process visualization across the plant.
In this article, we will focus on DCS software, exploring its key functions, control features, and the role of the Human Machine Interface (HMI) in plant automation.
What is DCS software?
DCS software is the application layer of a Distributed Control System that manages, monitors, and controls industrial processes in real time. It collects data from field instruments such as sensors and transmitters, processes this information, and executes control algorithms to maintain stable plant operations.
The software also generates alarms, logs events, performs performance calculations, and provides graphical visualization through the Human Machine Interface (HMI). By enabling centralized supervision and distributed control across multiple controllers, DCS software improves efficiency, safety, reliability, and decision-making in industries such as power plants, oil and gas, chemical processing, and manufacturing.
Functions of DCS Software
The software of the DCS consists of a wide range of functions to meet the requirement of plants. Some of these functions are:
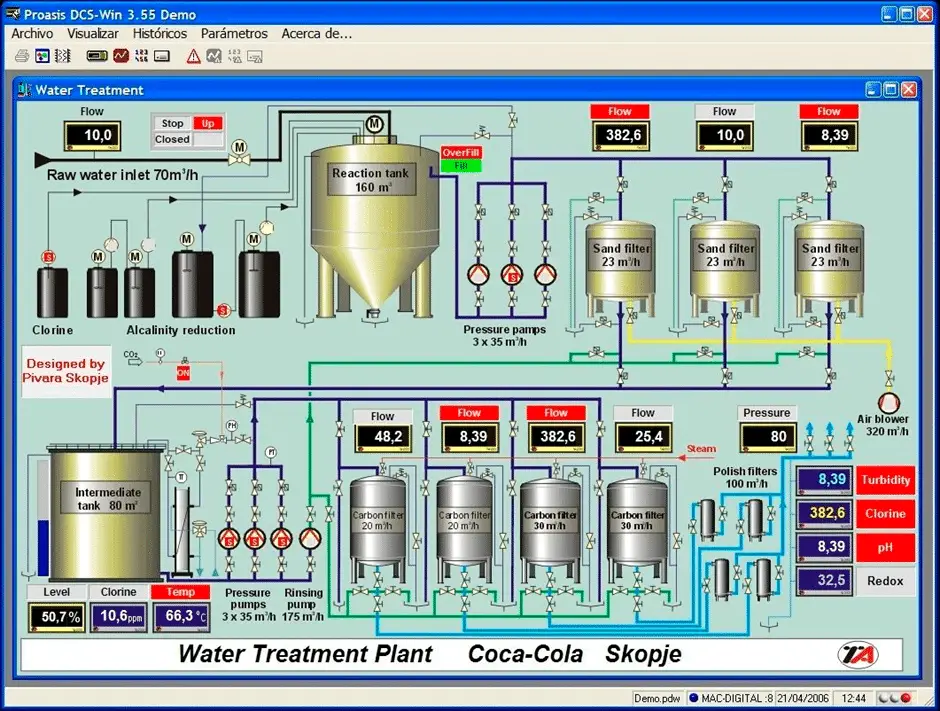
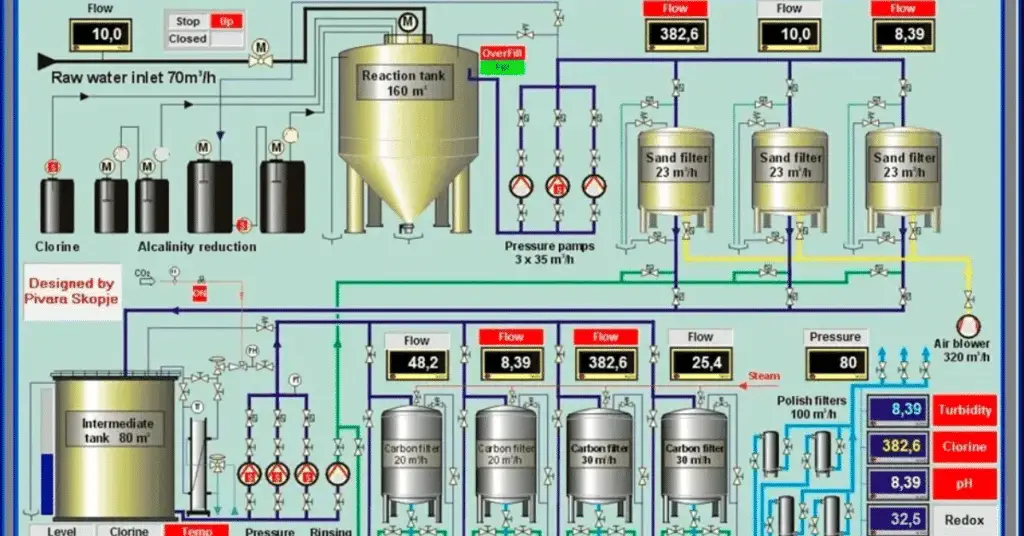
- Graphics of the process showing live values of the process parameters
- Status of all the compressors, pumps, heaters, and many such types of equipment.
- Data acquisition and alarming
- Data Logging
- Performance Calculations
- Control Functions
Let us discuss all these functions in detail.
1. Data Acquisition and Alarming
The DCS system will acquire process parameters at a variety of scan rates that perform input conditioning and calculations. These parameters are stored in the database of the DCS which can be used in the future for analysis purposes.
Various alarms are also generated by the DCS as per the alarm levels defined in the DCS. These alarms will alert the panel engineer by giving a visual alarm in terms of color change and text and audio alarm. This way if any process parameter goes out of the limit or on alarm level, the panel engineer will come to know about it and take necessary action.
2. Data Logging
The data logging software module is used to assign several printers at the unit level for the logging functions. Here, a printer can be selected for any type of log which can be initiated on demand times. These logs and formats can be configured.
There are some logs that are important. They are:
- Periodic Logs: Periodic logs are the log reports for hourly, daily, monthly, or pre-determined time intervals such as for the start-up and shutdown of any unit of the plant.
- Event logs: Event logs are the log reports for alarms, sequence of events, operator actions, and hardware faults.
- Demand logs: Demand logs are the logs such as operator-requested log printouts like shutdown trip analysis logs, maintenance logs, and performance logs.
3. Performance Calculations
The capability of a high-level programming language will enable easy performance calculations. Based on the average record data, these calculations can be initiated on each scan cycle periodically. These performance calculations help to increase the performance of the plant.
4. Control Functions
The control functions are distributed on various DCS controllers so that each controller can store the configured functions from the unit level out of a set of standard algorithms. The unit-level computers (ULCs) will supervise the plant status and send the target values to the lowest-level controllers.
5. Human Interface System of DCS
The DCS will provide a CRT-based man-machine interface. This CRT has features like keyboards and light pens for plant operation. The panel engineer can operate the plant equipment like valves, pumps, and heaters from the HIM itself provided that the functionality of controlling is given by the HMI.
Components of an HMI:
The components of an HMI are:
- Communication Media: Communication media consists of cables/wire media, like Ethernet and serial; and media radio/wireless media, like WIFI, GSM Modem, and Radio. In the case of remote control, Ethernet is the best option to use.
- Computer Hardware: Computer hardware consists of a minimum specification of a good processor, a blank 500 GB hard disk, 4 GB RAM, a mouse, keyboard, speakers, and a network adapter already installed.
- HMI Software: HMI software consists of operating software that can help the panel engineer visualize the plant virtually and control the plant from the HMI.
The functions of HMI (Human Machine Interface) are:
- HMI provides up-to-date plant information to panel engineers through a graphical user interface.
- HMI also functions as an engineering development station through which the engineers can edit the graphics, change the program written in the controller, and update the alarms and their levels.
The HMI includes the following parts:
- Static and Dynamic Display
- Alarm Display
- Trend Display
- Reporting Display
- Mimic Display
- Bar Chart Display
Static and Dynamic Display
The HMI screen has two types of display. They are:
Static object
A static object is an object which is directly related to the equipment or database. For example, static text, production unit layout
Dynamic object
Dynamic objects are the objects which allow the operators to interact with the process, equipment, or databases and also allow the operators to take control actions. Example, valves, pumps, compressors, pushbuttons, etc
6. Alarm Display
The DCS has an easily understandable group display of alarm occurrences. The alarm will trigger when the value of the defined process variable goes above or below the defined alarm.
This will generate a text along with audio from the speaker (if a speaker is used) and help the panel engineer to come to know that the process variable has crossed a certain value. Also, other alarms like any plant trip, any valve open or close, any pump or compressor trip or stopped and other such abnormal conditions can be configured which will generate an alarm as per the alarm definition in the DCS.
There is one function that changes the color of the alarm also. If the alarm is still active then the color of the alarm text will remain Red (any other color can also be defined). When the alarm becomes normal, the text will again come back to its normal color.
7. Trend Display
Trend display shows the continuous process variables which can be understood and monitored in a better way when color graphs are used. These graphs can be summarized or historical.
- Trend displays give detailed information on parameters.
- Trend displays can be real-time or historical trend displays.
- The exact value/status can be read out through the cursor positioning on the curve.
8. Reporting Display
The reporting display would make general reports easier by using a report generator such as an alarm summary report. The reporting can also be reported in a database, messaging system, and web-based monitoring.
For making some specific reports, a specific report generator tool is available. These reports can be accessed in various ways including periodic activation at a certain interval like daily or monthly activities. Also, the demand operators can be used for accessing reporting displays.
9. Mimic Display
The mimic display has a mimic diagram of a predefined library. The plant can be controlled from the mimic display. The mimic diagram can be zoomed in from an overview mimic diagram which displays a target mimic. For example, point details and emergency details can be zoomed in.
10. Bar Chart Display
The bar chart display has vertical bars which represent the values of variables. There is an alarm limit indication on the bar. The color of the bar changes on the alarm. There are some operating parameters displayed alongside the bars. The bar chart display can be operated from a CRT/keyboard.
List of Popular DCS Software Platforms
| DCS Software | Company | Key Features |
| PlantPAx | Rockwell Automation | Scalable plant-wide control, integrated architecture, risk reduction |
| DeltaV | Emerson | Flexible I/O, advanced control, batch processing, diagnostics |
| Ovation | Emerson | Power plant automation, SIS & SCADA integration, digital twin |
| System 800xA | ABB | Integrated DCS, electrical & safety control, asset management |
| Symphony Plus | ABB | Advanced automation, backward compatibility |
| Freelance | ABB | Compact system, scalable design, user-friendly engineering |
| SIMATIC PCS 7 | Siemens | Standardized libraries, lifecycle management, scalable |
| SIMATIC PCS neo | Siemens | Web-based engineering, collaborative platform |
| Experion PKS | Honeywell | Integrated control & safety, IIoT-ready |
| CENTUM VP | Yokogawa | High availability (99.99999%), strong reliability |
Conclusion
DCS software plays a vital role in modern industrial automation by enabling real-time monitoring, control, data logging, alarm management, and performance optimization. It acts as the intelligence behind the Distributed Control System, ensuring smooth coordination between field instruments, controllers, and operators.
With advanced HMI features such as trend displays, alarm displays, reporting tools, and mimic diagrams, DCS software improves operational visibility and decision-making. By selecting the right DCS software platform, industries can enhance plant efficiency, safety, reliability, and long-term productivity while supporting future digital transformation initiatives.
Read Next:
- Distributed Control System & Motor Control Center Interface Philosophy
- Technical Evaluation for DCS and ESD
- What is a Process Alarm? Its Types
- Design Basis for Fire Detection & Alarm System
- Difference between RS232 and RS485
- What is Fuzzy Logic & Its Components?
- Wiring Diagrams of PLC and DCS -DI, DO, AI, AO
- DCS Hardware Structure