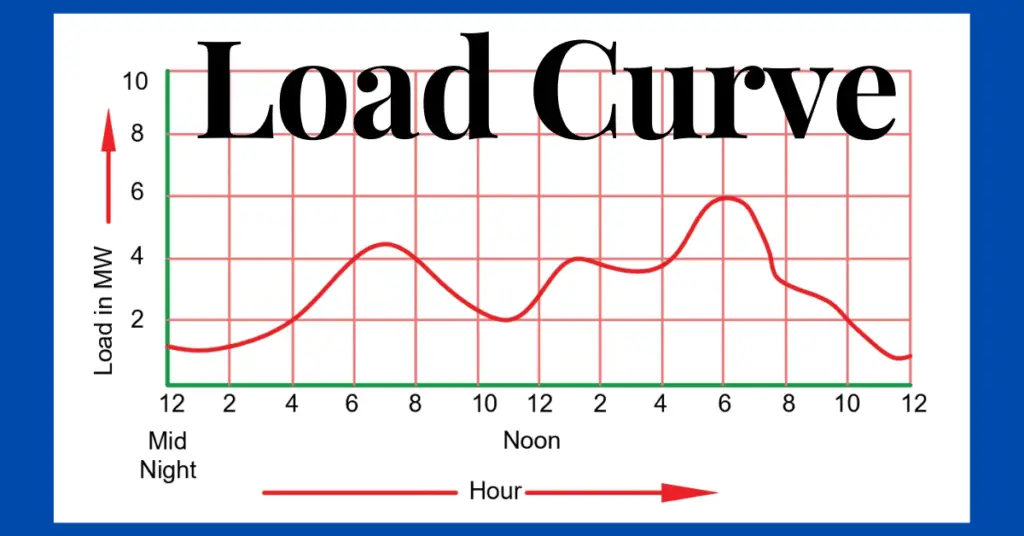
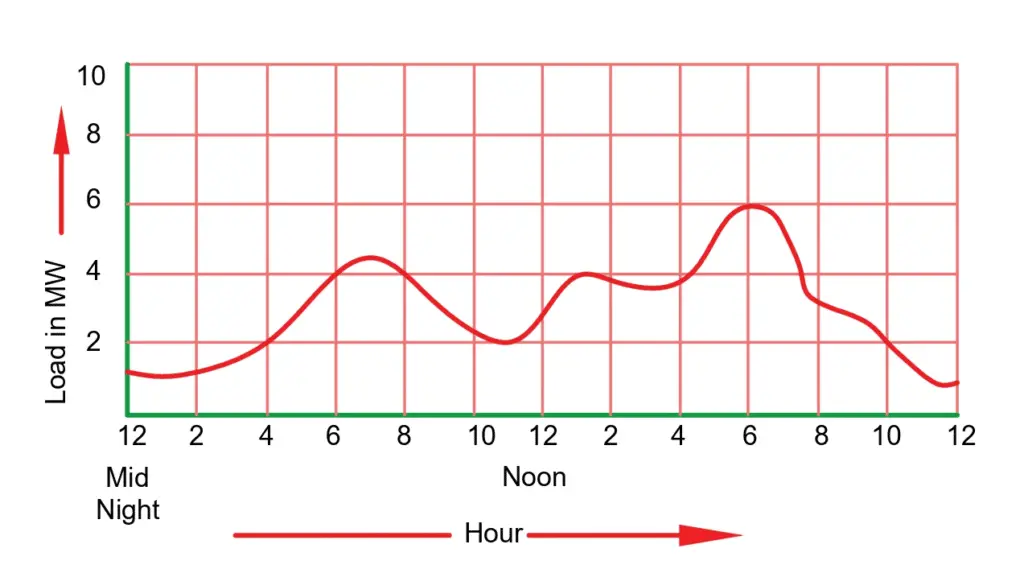
Load curves describe the variation in load demand from the consumer side on a power source over a period of time. A curve plotted over 24 hours are daily load curve. If plotted for a week, month or year then it is respectively called a weekly, monthly, or yearly load curve.
The load duration curve depicts the consumer end load variation over a period of time. Whether it is plotted for an industrial or residential purpose, it serves the purpose of determining the power required to be generated by generating stations to meet consumer demand.
Types of Load Curves
There are three types of load curves. They are-
- Daily Load curve
- Monthly Load curve
- Yearly Load Curve
Daily Load Curve
The load demands from the consumer side vary and it does not remain constant. To know the peak demand on the generating station, the load on a power station during the whole day (i.e. for 24 hours) is recorded half-hourly or hourly.
Then the graph is plotted with respect to time to obtain the daily load curve of the power plant.
Monthly Load Curve
We can plot the monthly load curve of the power station from the daily load curves for a particular month. The average values of the load over a month at different times are first calculated and then the graph is plotted, The purpose of the monthly load curve is to fix the rate of the energy.
Yearly Load Curve
We can plot the yearly load curve from the monthly load curves of that year. The average values of the load over the year are first calculated to draw the yearly load curve. The load factor is very important data for a power-generating station. The annual load factor can be determined by the yearly load curve.
Importance of Load Curves
The Load curves provide the following important information of generating station.
- The load demand from the consumer side varies depending on the time of loading, season, and other factors. Therefore, the load on the generating station can not be practically constant. When we plot the graph between the load and time of the day, we will find the load variation with respect to time. Thus, a daily load curve shows the dissimilarity in the load on the power plant during the different hours of the day.
- If we observe the daily load curve, we will find that the load at a particular time is maximum. The maximum demand at a particular time on the daily load curve is called the peak load. The peak point on the curve shows the maximum demand for the power station on that day. Thus, the peak point on the curve shows the highest demand for the Power Station for that day.
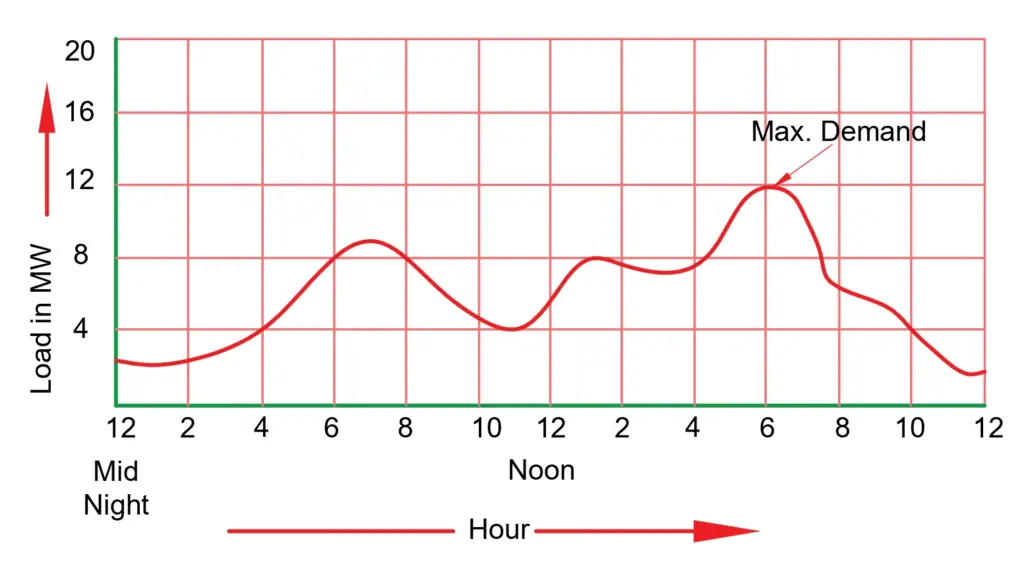
- After knowing the maximum demand by a daily load curve, it is possible to determine the size of the generating station and the number of generating stations.
- It shows the load demand for different times of the day. Suppose, for a particular day, in the morning at 10 A.M. load demand is 100 MW and 200 MW at 7 P.M. We can run a single generator to meet the load demand in the morning and parallel one more generator in the evening to meet the load demand. Thus, it is possible to economically dispatch the power by power scheduling for the different times of the day on the basis of curve data. The sequence and time to shut off or to start smaller units at a certain time are made clear by anticipating the load curve. It provides data on the number of units and size of generating stations required to meet the power demand. Thus, the generating stations can thereby plan a specific schedule to generate power in the most economical manner.
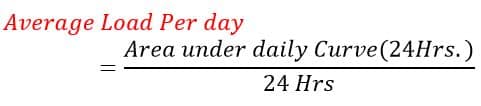
- The number of kWh(Units) generated on the day can be calculated by the area under the daily load curve. Electrical energy(kWh) generated per day = Area (in kWh) under the daily load curve
- We can calculate the average load using this daily load curve. The average load is equal to the ratio of area under the daily load curve and the total number of hours of that day. Mathematically, the area under the curve provides the units consumed for that duration, and units consumed divided by time gives the average load.
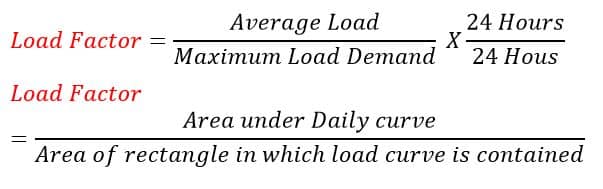
- We can also calculate the load factor of the generating station by dividing the area under the load curve by the total area of the rectangle.
Selection of Generating Units
As discussed before the load on the generating station is not constant during the day, and the load on the generating station keeps varying. If we operate a single generator to meet the varying load requirement, then we will find that sometimes the generator gets fully loaded and most of the time it will operate at low loading. As we know, operating a generating station at low loading is not economical because of the lower efficiency of the plant and it causes an increase in the generation cost. Therefore, for economic electricity generation, the generating station has different ratings of generators.
What are the criteria for choosing the ratings of the generating units? The answer is that before selecting generating units we must have the annual load pattern on the generating station. How can we find the annual load pattern? We can find the annual load pattern by the station’s annual load curve.
By minutely studying the annual load curve, we can operate the generating units at their maximum efficiency.
How to select Generating Units?
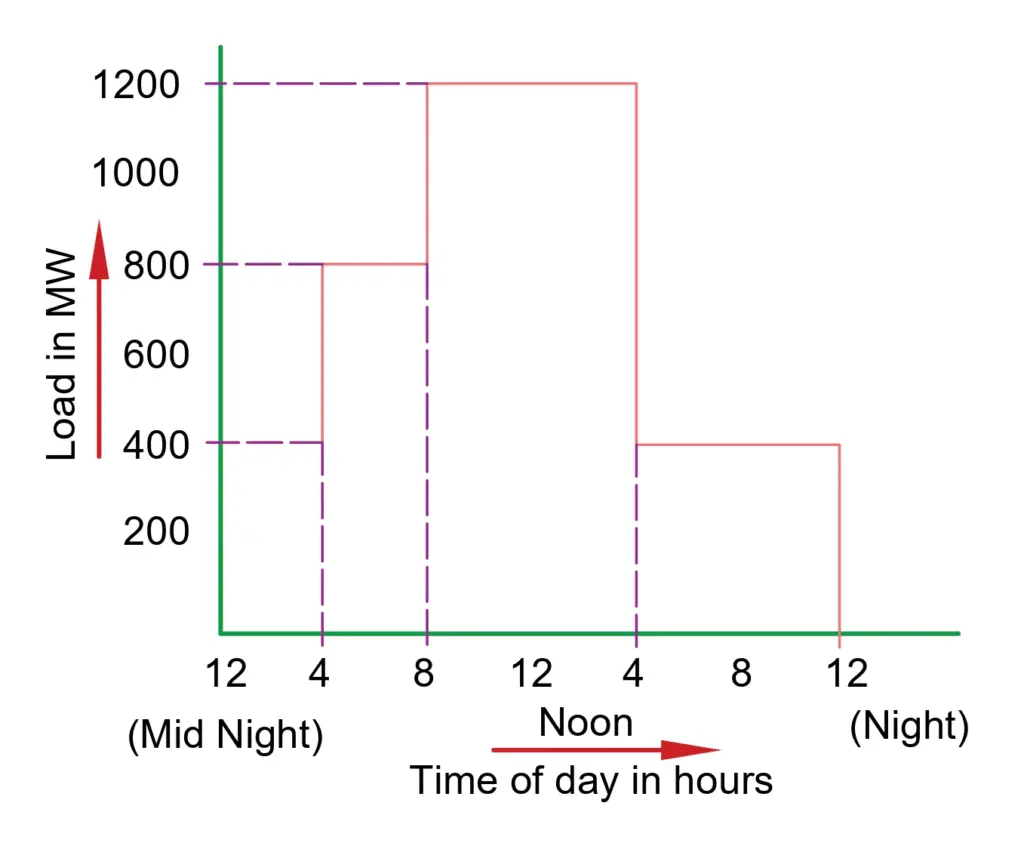
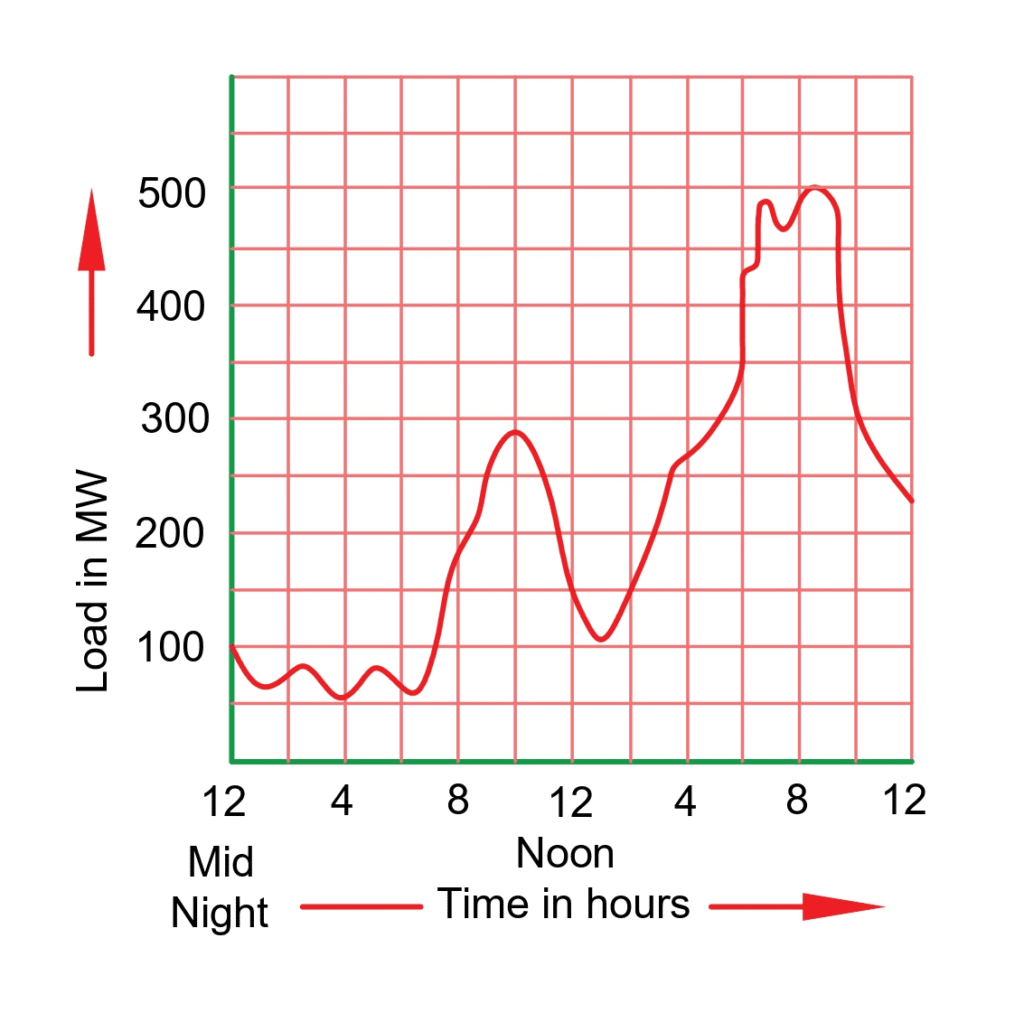
Let us take a load curve to understand the selection process of generating units.
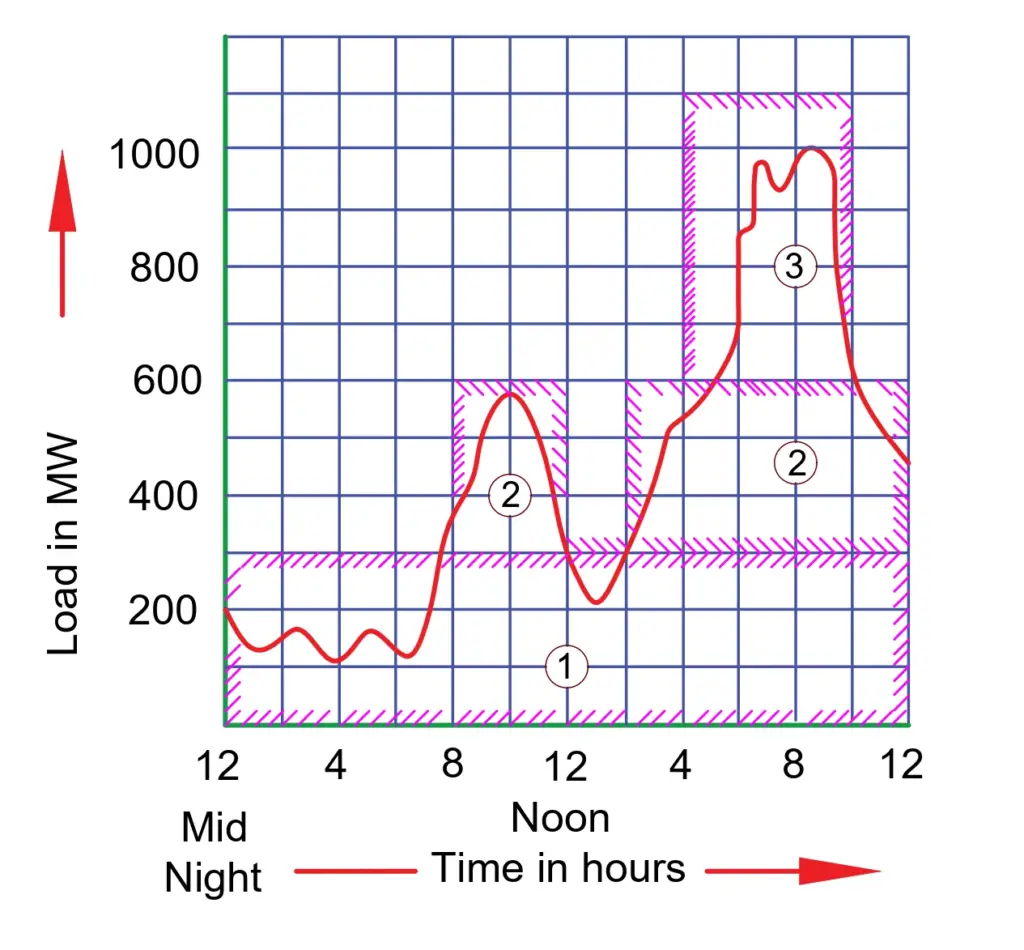
It is evident from the curve that there is a large variation in the load on the station. The minimum load is around 100 kW and the maximum load approaches 1000 kW. The single unit of rating 1000 kW to meet the all-day load requirement will be highly uneconomical.
Therefore, for economical generation, several generating units of different ratings are used to meet load requirements according to the load curve. As shown in the above load curve, the plant capacity is divided into three units numbered 1, 2, and 3.
In this case, the operating schedule can be as follows:
| Time | Units in Operation |
|---|---|
| From 12 midnight to 7 A.M. | Only unit no.1 operates |
| From 7 A.M. to 12.00 noon | Both units 1 and 2 Operate |
| From 12.00 noon to 2 P.M. | Unit no. 2 stops and only unit 1 operates. |
| From 2 P.M. to 5 P.M. | Unit no. 2 is again started. Now units 1 and 2 operate |
| From 5 P.M. to 10.30 P.M. | Units 1, 2, and 3 operate |
| From 10. 30 P.M. to 12.00 midnight | Units 1 and 2 operate |
Thus, it is possible to generate electricity economically if the number and size of generating units are selected properly. As a result, the generation cost gets reduced.