Peek’s formula and Peterson’s formula is used for corona power loss calculation. Due to corona effect, the loss of power in the transmission line is called Corona Power Loss. The power loss effects the efficiency of the transmission line. But the voltage regulation will not get affected much.
Corona effect generates several high-frequency harmonics that begets the radio interference with neighboring communication lines.
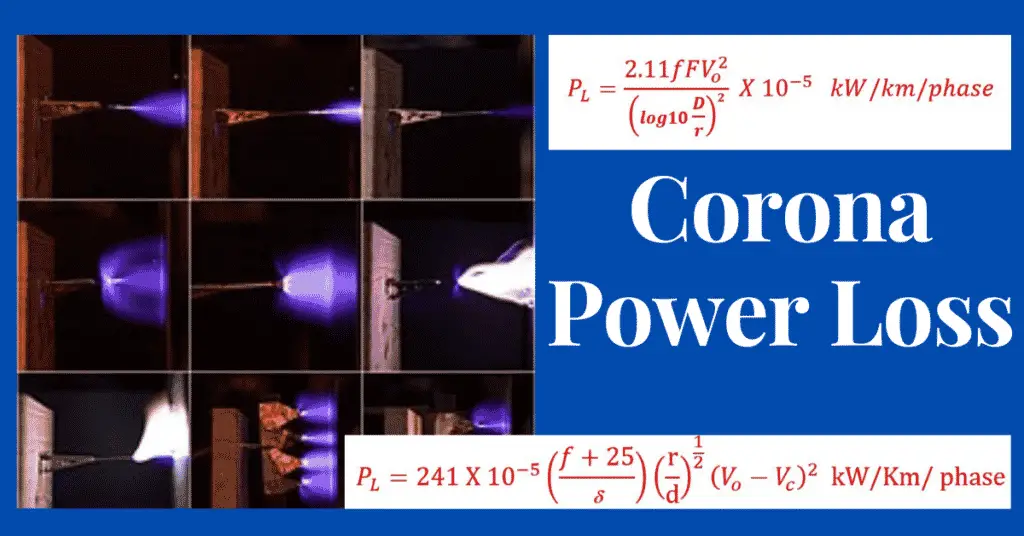
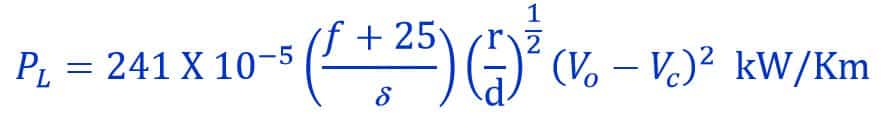
Corona power loss is one of the losses occurring in transmission lines that affects most and decreases the efficiency of transmission line. The accurate estimation of corona loss is difficult of its variable nature. The corona loss under appropriate weather conditions is given by the Peek’s formula:
Corona Power Loss Equations
There are two equations for corona power loss calculation.
- Peek’s Formula
- Peterson’s Formula
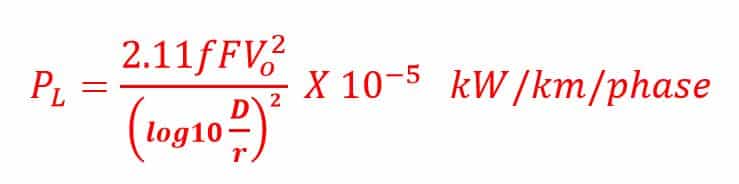
Peek’s Formula:
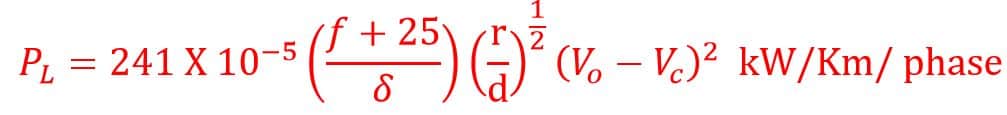
Where,
PL = Corona Power loss kW/km/Phase
f = supply frequency in Hz
r = radius of conductor in meters
d = distance between two adjacent conductors in meters
V0 = Operating voltage in kV
VC = Critical disruptive voltage in kV
d = Air density correction factor
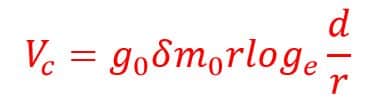
The minimum phase voltage at corona effect appears is called the visual critical voltage Vv. The formula of critical voltage is ;
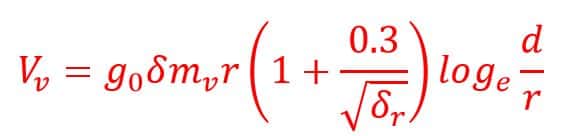
Where,
mv is the roughness factor. This factor shows the degree of smoothness of conductor’s surface. Its value is unity for smooth conductors. The value of mv decrease with increase of roughness of conductor’s surface.
δ is the density factor of the air.
r is the radius of the conductor.
d is the spacing between the line conductors.
g0 is the dielectric strength of air.
The mathematical expression for the disruptive critical voltage is;
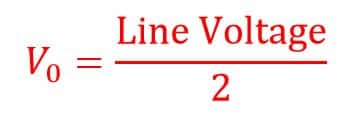
It is to be noted that for a single-phase line V0 is,
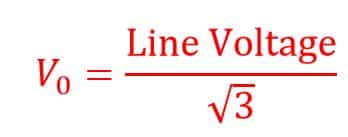
And for a three-phase line V0 is,
Peek’s Formula is applicable in case of visual corona. This formula usually gives inaccurate results when the losses are low, and V0/VC is less than 1.8
Peterson’s Formula
where,
PL = corona power loss, kW/km/Phase
f = frequency of supply in Hz
V0 = voltage per phase in kV
r = radius of conductor in meters
D = spacing between conductors in meters
Factor F is the corona loss function. It varies with ratio (VO/VC).
The value of Factor F is given below.
| Vph / Vd0 | 0.6 | 0.8 | 1.0 | 1.2 | 1.4 | 1.6 | 1.8 | 2.0 | 2.2 |
| Factor(F) | 0.012 | 0.018 | 0.05 | 0.08 | 0.30 | 1.0 | 3.5 | 6.0 | 8.0 |
Factors Affecting Corona Power Loss:
The following factors affect the corona power loss.
1. System Voltage
The electric field around the conductors will be greater when the voltage will be greater. The higher voltage generates strong electric field around the conductor and ionizes the surrounding air. Therefore corona power loss will be greater for higher voltage.
It is evident from the corona power loss equation that the rate of increase of power loss will be small when Vph is near Vd0 but as the Vph is larger compared to that of Vd0 , corona loss will increase at a very high rate.
2. System Power Frequency
From Peek’s formula the corona power loss is proportional to PL∝(f+25). Therefore, the Corona Power loss is directly proportional to frequency. The corona loss increases with increase in the frequency.
3. Density of Air
The corona loss is inversely proportional to the air density. With the decrease in density of air the power loss due to corona increases. And, corona loss decrease with increase in the air density. For example, a transmission line passing through the hilly area will be subjected to more power loss due to corona than the line passing through plain lands because density of air is less at hilly areas.
4. Conductivity of Air
The ions in the atmosphere are more during the stormy and rainy weather. Hence, the atmosphere is more conductive. The higher conductivity of air means there are more ions around the conductor surface. The more ions in the air cause more corona loss.
In the rainy season, the conductivity of the air is more and hence it leads more corona loss.
5. Conductor Radius
The electric field intensity at the conductor surface is less for a greater conductor radius which results into less corona loss. The smaller diameter conductor cause more corona loss because of high electric field intensity at the surface of the conductor.
6. Conductor Surface
For a stranded conductor, the corona loss is more as the potential gradient at the surface of the stranded conductor is more than that of a single equivalent conductor.
Corona power loss is more for a rough surface conductor as a rough surface gives rise to a high potential gradient.
7. Atmospheric Condition
Corona loss is more prominent in bad weather conditions, such as foggy day or rainy day.
8. Load Current
The transmission line gets heated to some extent due to the flow of load current in the transmission lines which will reduce the effect of corona loss, as heating will prevent the deposition of snow or dew on the surface of conductor.
9. Bundling of Conductors
Compared to that of a single equivalent conductor, the effective diameter of a bundled conductor is large. It is clear from the above corona power loss equations that a larger diameter value results in less corona power loss.
Solved Problem on Corona Power Loss Calculation
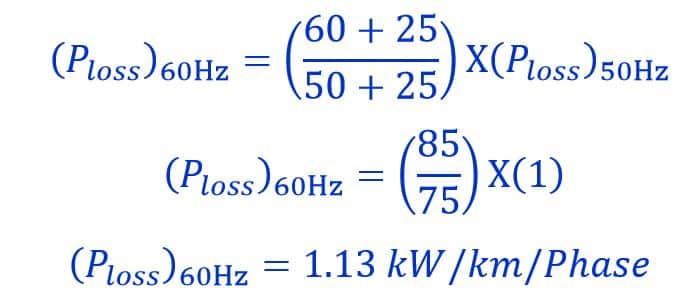
On a particular system, the corona loss at 50Hz is 1kW/km per phase. What would be the corona loss at 60Hz in the same system?
The corona loss
Therefore, corona loss is directly proportional to (f+25)
Where,
f = supply frequency in Hz
r = radius of conductor
d = distance between two adjacent conductors
V0 = Operating voltage in kV
VC = Critical disruptive voltage in kV
d = Air density correction factor
Calculation:
Given Data
f1 = 50 Hz, f2 = 60Hz, PL1 = 1kW/km/phase